

There’s a particular kind of metric that shows up in media reports and looks, at first glance, like a real finding.
Average coverage quality score: 7.4. Key message penetration: 34%. Sentiment: 38% positive.
People nod. The number goes into the deck. Someone asks, “Is that good?”
But nobody quite knows.
This is the quiet problem at the heart of qualitative media measurement. Not that the metrics are wrong exactly. It’s that we’ve built a habit of aggregating things that weren’t really designed to be aggregated — and then asking the resulting number to tell a story it fundamentally cannot tell.
Qualitative analysis is built to classify, not to average
When a skilled analyst scores a piece of coverage — assessing brand prominence, message pull-through, sentiment, reputational impact — they’re doing something genuinely valuable. They’re making a judgment call about what that story actually did. Whether it moved the needle or barely registered. Whether it carried the brand’s narrative or buried it in paragraph eleven.
That judgment, applied across a body of coverage, can surface real insight. It can tell you which stories deserve executive attention. Which journalists are writing with depth and alignment. Which themes are generating reputation-building coverage versus passing mentions. Which handful of stories are actually doing the heavy lifting.
The insight lives in the classification. In the distribution. In the specific stories at the top and bottom of the range.
The moment you collapse all of that into a single average, most of what made the analysis valuable disappears. You’re left with a number that looks precise but has quietly discarded the nuance it was built on.
The average doesn’t know what it’s averaging
Here’s the problem in concrete terms.
A brand runs a campaign with strong earned media pull-through. Thirty out of 100 stories carry one or more key messages. Key message penetration: 30%. A useful signal.
Then a syndicated article picks up the brand in passing. It runs in 100 additional outlets — low depth, no key messages, neutral context. The message-bearing coverage hasn’t changed. But watch what happens to the metric.
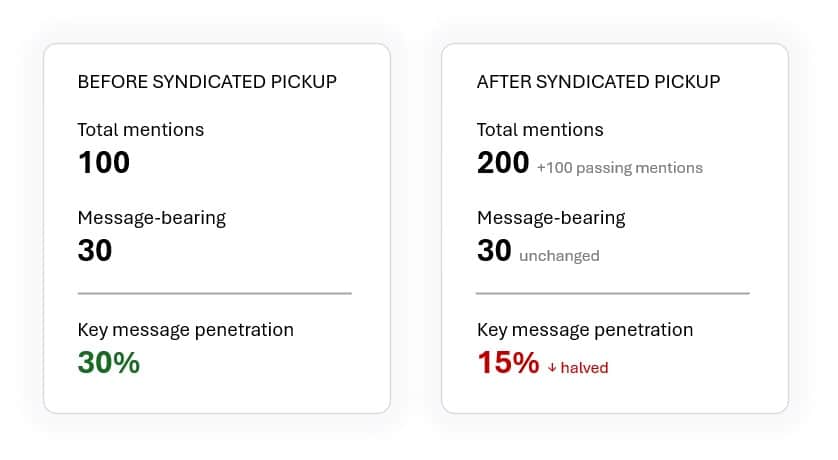
The penetration rate drops to 15% — not because messaging got weaker, but because the denominator doubled. Visibility increased. The metric fell. Without context, that looks like a bad quarter for communications. It wasn’t.
That’s a mechanical problem, and a fixable one. But it points toward a deeper issue.
The same dynamic plays out with quality scoring, and it’s harder to see. Imagine a quarter where a brand generates strong feature coverage — well-placed, message-rich stories in relevant outlets. The average quality score is 7.6. Good quarter.
Next quarter, the same syndicated pickup happens. Similar feature coverage, similar volume, but now surrounded by 200 low-depth passing mentions. The average quality score drops to 6.1. The underlying quality coverage held steady. The average fell because the mix changed, not because performance weakened.
But even that is still a mechanical problem — fixable with denominator awareness and better framing.
The harder issue is what the average obscures even when volume is stable.
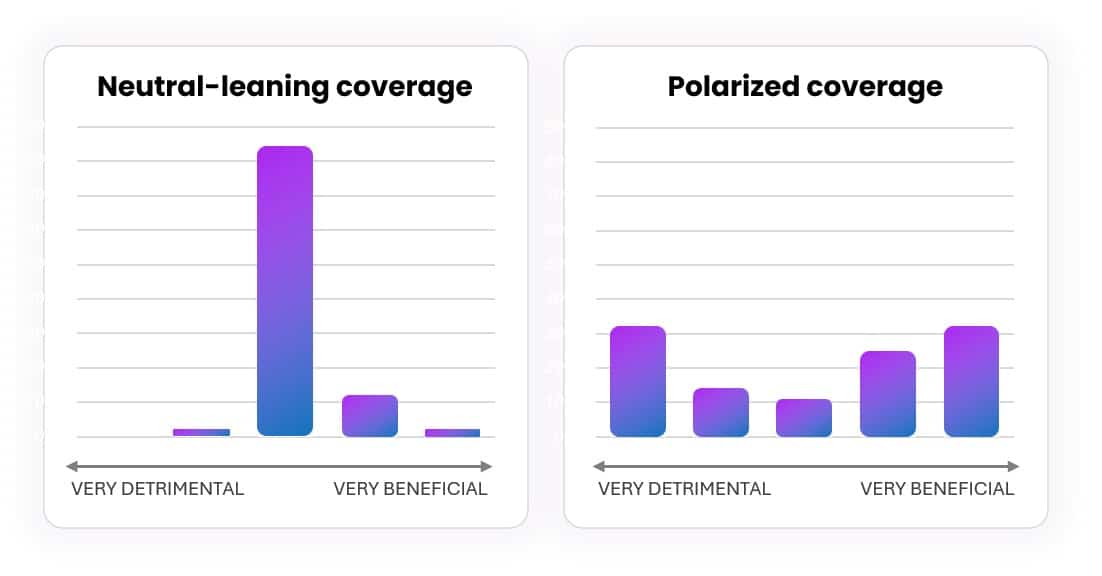
A score of 7.2 could mean nearly all coverage was quietly neutral. It could mean a polarised quarter where strong positives and damaging stories cancelled each other out. It could mean a handful of excellent feature stories surrounded by a sea of routine mentions. Same number. Completely different quarters. Completely different implications for what you do next.
The average temperature between a pizza oven and a walk-in freezer might look like a pleasant room. But no one would confuse that average with a livable environment. Qualitative media scores can work the same way: technically accurate, but blind to the distribution that actually matters.
The average doesn’t know which of those it’s describing. And without that knowledge, it’s not really a finding. It’s a prompt to go and look at the actual coverage — which is what you should have been doing in the first place.
When the metric becomes the goal
For PR teams, the danger is not just bad reporting. It is bad interpretation. A single score can make a strong quarter look weak, hide emerging reputational risk, or create pressure to chase coverage that improves the metric without improving the brand’s position.
When a number appears consistently in reports, teams will start managing to it. Key message penetration becomes a KPI. Average quality score becomes a target. And once that happens, teams can start optimising for score-friendly coverage rather than strategically valuable coverage — pursuing the stories most likely to perform well in the aggregate, rather than the ones that actually serve the communications objective.
That’s a subtle but real distortion. A nuanced feature in a tier-one outlet that engages critically with your brand narrative might score lower than a cluster of compliant, message-repeating articles that nobody influential reads. The scorecard can quietly reward the wrong things.
This is the measurement trap. The metric was meant to reflect the quality of the work. Instead it starts to shape it.
What qualitative metrics are actually good for
None of this means qualitative scoring is a waste of time. The opposite is true — it’s one of the most useful things media measurement can do. But its value is specific.
Qualitative analysis earns its keep when it helps you find things. The stories that actually shaped reputation. The pieces that carried your messages into the right hands. The articles that introduced risk and deserve a response. The patterns across outlets, journalists, or themes that tell you something about where your narrative is gaining traction — and where it isn’t.
That’s the work. Surface the signal. Explain the composition. Show what is driving the shape of coverage. Help communications teams understand not just whether the numbers moved, but why they moved, what changed in the underlying coverage, and what might require action.
An average score, sitting alone, does none of that. But a clear view of the distribution — what share of coverage was genuinely reputation-building versus awareness-building versus detrimental, and why — starts to tell a real story. Add the specific stories that explain each category, and you have something a communications team can actually use.
There are cases where an average score earns its place — particularly when the methodology is stable and the coverage mix is broadly comparable from one period to the next. Tracked over time, a consistent score can be a useful signal that something has shifted and warrants a closer look. But even then, it’s a signal to investigate, not a conclusion to report in isolation.
This is something we think about constantly in Agility’s Media Intelligence team — how to design reporting programs that give clients metrics they can actually make decisions with, rather than numbers that look rigorous but obscure more than they reveal.
The question worth asking
Before your next report goes out, it’s worth sitting with one question: if you removed the aggregate quality score, would the report be weaker?
If the answer is yes — if the number is load-bearing — that’s worth examining. A qualitative metric should be a summary of insight the report has already demonstrated, not the primary vehicle for delivering it.
The number can stay. But it should not be asked to stand alone. It needs the distribution, the composition, and the specific stories that explain what it actually means.
Qualitative media measurement is at its best when it refuses to pretend that a single number can hold a complex picture. When it shows the shape of coverage rather than just the score. When it uses analyst judgment to explain, not just to quantify.
The insight was never in the average. It was in everything the average was made from.

